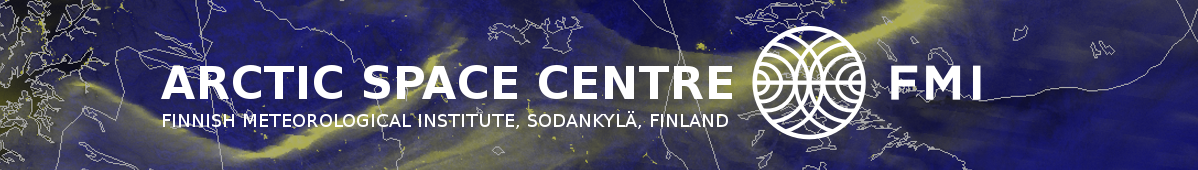
Latest UV index from Sodankylä:
UV index from yesterday (blue) and today (orange).
More data available at LITDB: UV and Ozone data from Brewer spectrometer.
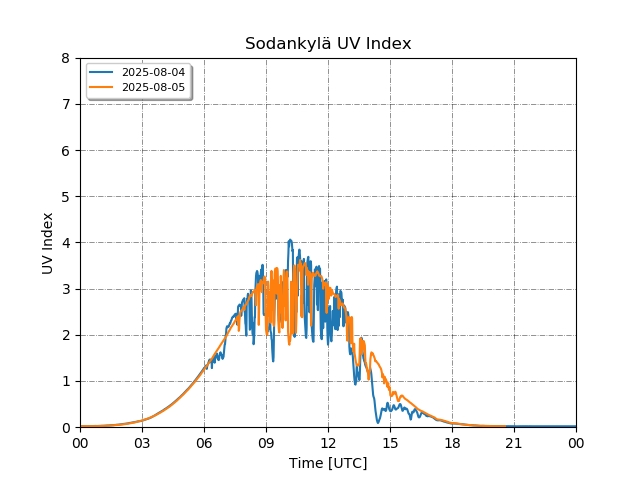
Latest ozone sounding:
The ozone vertical distribution in Sodankylä is measured by launching an ozonesonde. More data available at LITDB: Ozone soundins.
The black line is the profile from the latest sounding. The blue line shows the average of the same month for the years 1989-2001.
If the balloon reaches altitude high enough, total column ozone expressed in Dobson Units (DU) can be calculated from the profile.
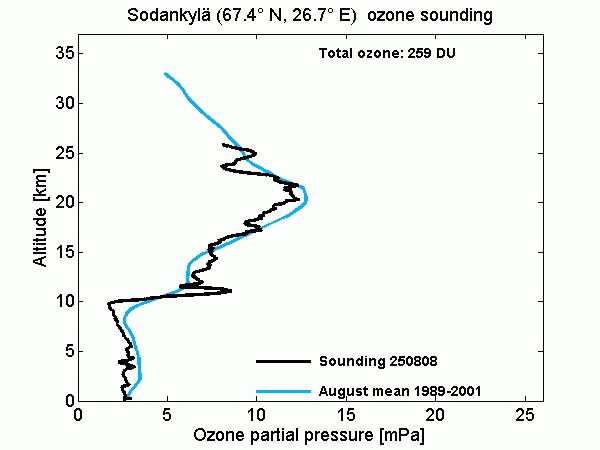
Latest ozone data:

Amount of ozone from February 2025 to January 2026 as a function of time and height.
More data availabe at LITDB: Yearly panels since 1989.
The magenta bars show the maximum 30 minute average of UV index for each day and the black line shows total ozone values measured by the Brewer spectrophotometer.
The cyan line is the average ozone column measured by the TOMS satellite 1979-1992. The standard deviation is indicated by vertical lines.
From mid October to the end of February the sun is too low for UV and total ozone measurement.
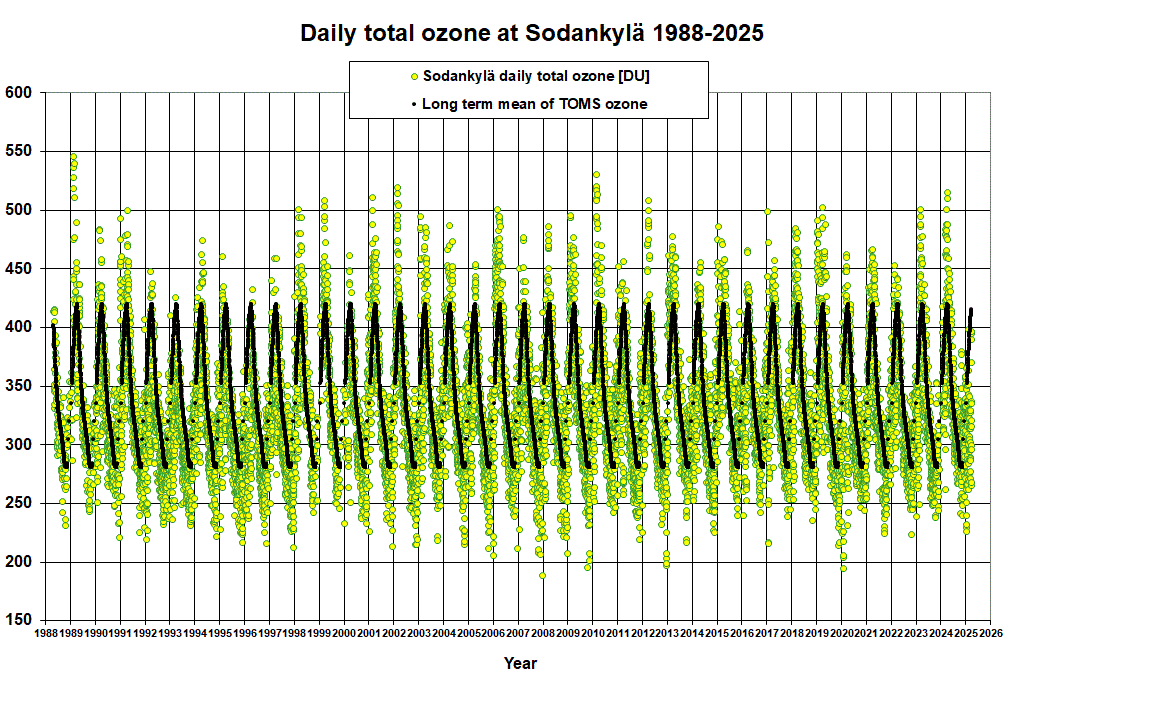
Daily total ozone values of Sodankyla expressed in Dobson Units (DU) (yellow dots) are mainly Brewer spectrophotometer data. Gaps in time series are filled by data from SAOZ.
The black line presents the long time mean of TOMS satellite instrument observations.
Instant satellite measurement of UV and Ozone procuts at sampo.fmi.fi.
Latest total ozone map of the Northern Hemisphere is available at Environment Canada.
Contacts:
UV and Brewer measurements: Kaisa Lakkala and Tomi Karppinen
Ozone soundings: Rigel Kivi